Alliance for Automotive Innovation today released its exclusive state-by-state analysis of the U.S. electric vehicle (EV) market for Q2 2024.
The Get Connected Electric Vehicle Report Q2 2024 summarizes EV sales and purchasing trends across all 50 states and a breakdown of light-duty market share by powertrain (2016-2024).
Sales up sequentially and year-over-year
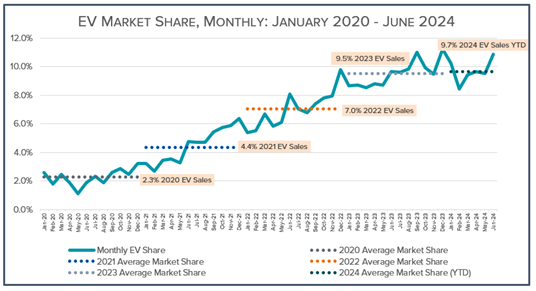
- EVs represent 9.96 percent of new light-duty vehicle sales in Q2 2024, up from 9.34 percent in Q1 2024 and 9.05 percent in Q2 2023;
- 117 EV cars, utility vehicles, pickup trucks and van models now available for sale in the U.S. in Q2 2024. Light truck sales represent 84 percent of EV market;
- 10 states with EV registrations above 10 percent in Q2 2024:
-
- California (26.72 percent); Colorado (19.43 percent); District of Columbia (19.35 percent); Washington (17.87 percent); Oregon (15.97 percent); Nevada (15.4 percent); Hawaii (14.39 percent); New Jersey (13.25 percent); Vermont (11.93 percent) and Massachusetts (11.57 percent).
- 386,221 EVs registered in U.S. in Q2 2024, a 9 percent increase over Q2 2023;
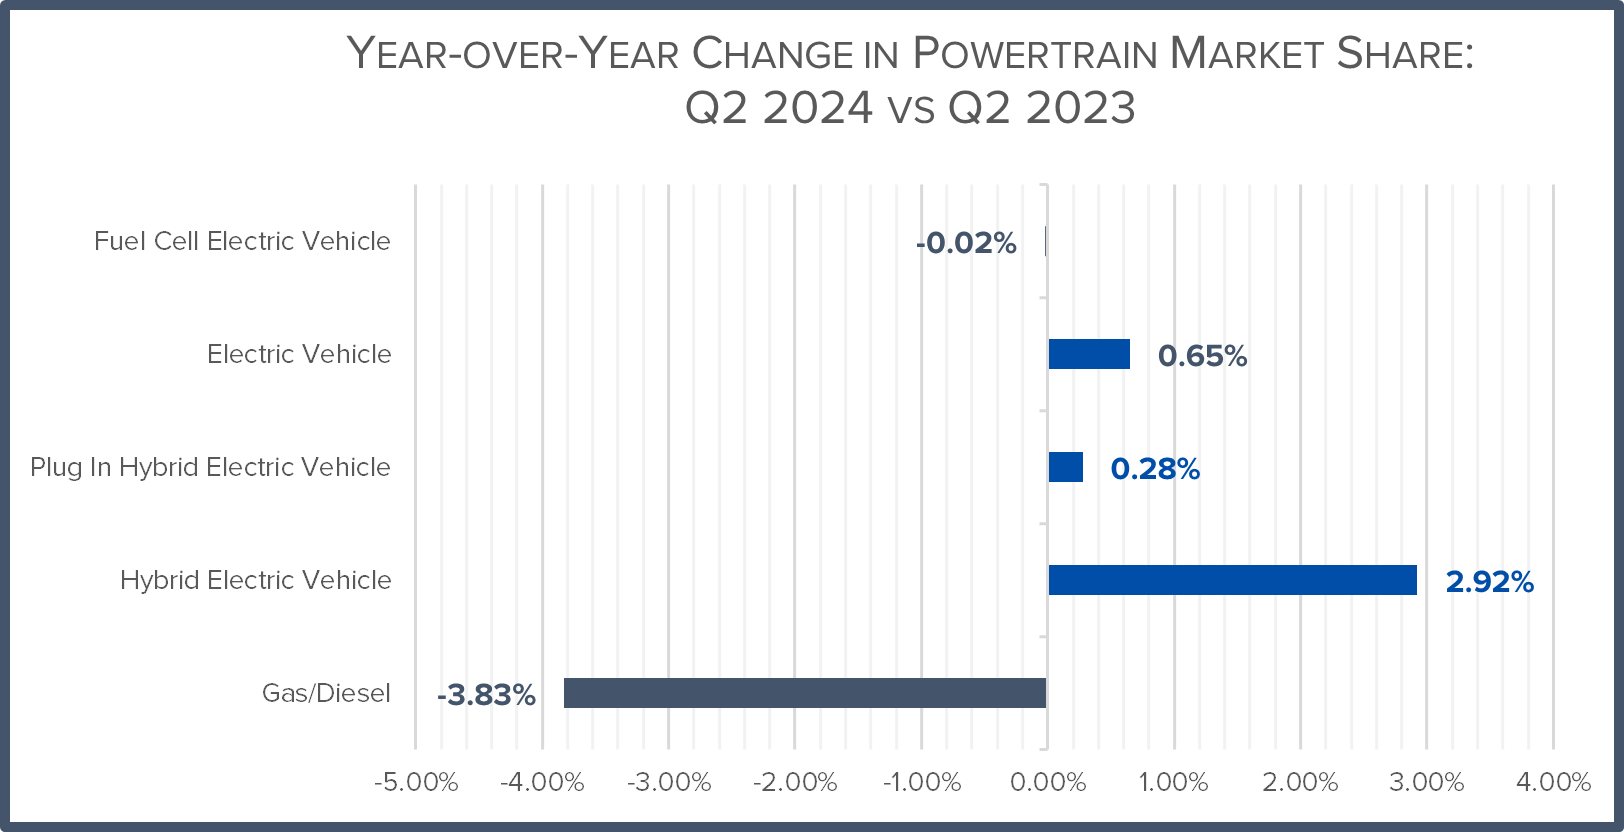
- Year-over-year, total light-duty sales (all powertrains) decreased by 1.1 percent. Hybrid electric vehicle market share grew 2.92 percent, while internal combustion engine (ICE) vehicle market share contracted 3.83 percent.
Public EV charging still lags
- In Q2 2024, the number of publicly available EV chargers increased 6 percent from Q1 2024 – while total EVs on the road increased 8 percent;
- Nationwide, 386,221 EVs were registered in Q2 2024 but only 10,121 new public chargers were added – a ratio of 38 new EVs for every new public port;
- There are 5.1 million EVs on the road and a total of 177,330 publicly available charging outlets in the U.S. – a ratio of 29 EVs for every public port;
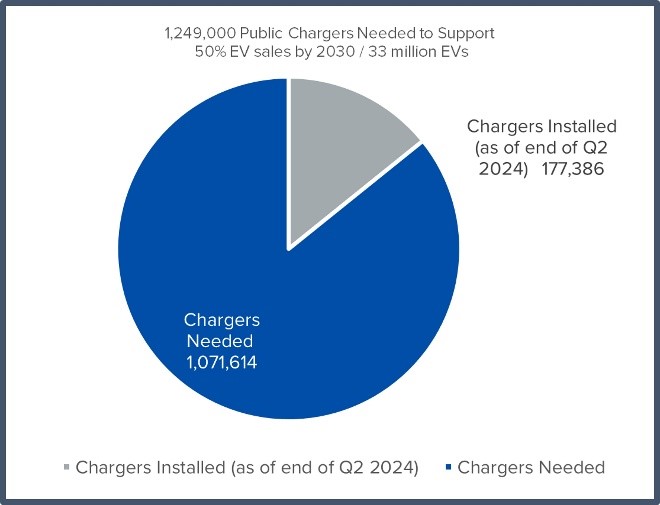
- More than 1 million more public chargers (933,061 L2 and 138,609 DC Fast) are required to meet the National Renewable Energy Laboratory’s necessary infrastructure estimate for 2030;
- 451 chargers will need to be installed every day – nearly 3 chargers every 10 minutes – through the end of 2030.
Spotlight: Localizing the EV supply chain and competition from China
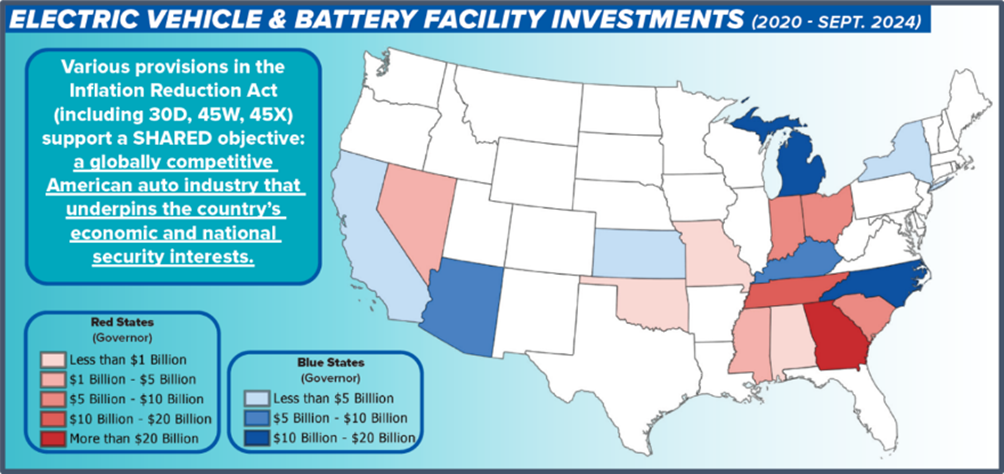
- Automakers and battery manufacturers have made considerable investments downstream outlaying more than $123 billion for more than 80 projects and creating 114,000 jobs across 18 states:
- More than $90 billion has been outlaid for EV battery production facilities in the U.S., creating an estimated 65,000 jobs;
- An additional $33 billion has been committed to EV assembly projects creating an additional 48,000 jobs.
- Still, the advantages by China’s early entry into EV manufacturing are sizable and a threat to U.S. global competitiveness:
- Government subsidies, labor rates, increased scale, vertical integration and less expensive battery prices mean Chinese exports (even with tariffs) provide an attractive cost comparison for consumers;
- In 2023, nearly 95 percent of all global EV sales were in China (60 percent), Europe (25 percent) and the United States (10 percent);
- China manufactures 30 million vehicles and has capacity for nearly 50 million – up from 2 million vehicles per year at the turn of the century. Almost one-third of that production is for electrified vehicles;
- China is manufacturing EVs on a scale equivalent to the entire vehicle manufacturing output of the U.S. auto industry.
