ALG, Inc., a subsidiary of TrueCar, Inc. and the industry benchmark for determining the future resale value of a vehicle, projects total new vehicle sales will reach 1,189,928 units in July 2020, down 18% from a year ago when adjusted for the same number of selling days. This month’s seasonally adjusted annualized rate (SAAR) for total light vehicle sales is an estimated 14 million units. Excluding fleet sales, ALG expects U.S. retail deliveries of new cars and light trucks to be 1,091,152 units, a decrease of 15% from a year ago when adjusted for the same number of selling days.
|
|||||
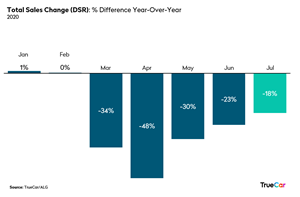
“The increase in COVID-19 cases across the country have caused states such as Texas, Florida and California to take steps back in their economic re-openings. Despite this trend, we are not seeing automotive sales drop as low as they did in the spring at a national level.” said Eric Lyman, Chief Industry Analyst for ALG, a subsidiary of TrueCar. “In fact, even with the low new vehicle inventory levels that we are noticing across many popular models, we’re seeing sales continue to bounce back,” said Eric Lyman, Chief Industry Analyst for ALG, a subsidiary of TrueCar.
“There’s finally some positive signs for automakers on the fleet side of the house,” added Lyman. “Fleet sales were down nearly 70 percent year-over-year last month, while this month we’re projecting the decline will slow to 40 percent with a 17 percent uptick month over month,” added Lyman.
A photo accompanying this announcement is available at: https://www.globenewswire.com/NewsRoom/AttachmentNg/231c5327-0f17-42d6-aa0b-d2b21e6e3f27
Additional Insights: (Forecast by ALG)
- Total retail sales for July 2020 are expected to be down 15% from a year ago when adjusted for the same number of selling days and up 6% from June 2020 when adjusted for the same number of selling days.
- Fleet sales for July 2020 are expected to be down 40% from a year ago when adjusted for the same number of selling days and up 17% from June 2020 when adjusted for the same number of selling days.
- Total SAAR is expected to decrease 16% from a year ago from 16.7 million units to 14 million units.
- Used vehicle sales for July 2020 are expected to reach 3,759,781, up 9% from a year ago and down 1% from June 2020.
- The average interest rates on new vehicle loans is 5.82%.
“Mainstream brands are steadily increasing their new vehicle sales month-over-month, especially brands with healthy inventory levels such as FCA. Their Jeep brand stands out for strong performance, likely driven by strong incentive programs as well as the inventory levels needed to satisfy the unique demands of shoppers,” said Nick Woolard, Director of OEM and Affinity Partner Analytics at TrueCar. “On the other end of the spectrum, new vehicles sales for luxury brands, such as BMW and Mercedes, are recovering at a slower rate. Consumers are not going back into the luxury market as quickly as mainstream brands, showing some budgetary discipline in reaction to the macroeconomic environment.”
“As consumers seek more cost-effective options while shopping, used vehicles continue to show strong recovery, up nine percent year-over-year and roughly in line with June. Lower than average inventory levels on new cars as well as economic uncertainly may be causing some consumers to opt for used vehicles,” added Woolard. “TrueCar marketplace data shows similar trends, with 11 percent of consumers who connected with dealers for pricing on a new vehicle ultimately purchasing a used vehicle. This is up 31 percent versus July 2019.”
July 2020 forecasts for the 13 largest manufacturers by volume. For additional data visit the ALG Newsroom.
Total Unit Sales
| Manufacturer | Jul 2020 Forecast | Jul 2019 Actual | Jun 2020 Actual | YoY % Change | YoY % Change (Daily Selling Rate) |
MoM % Change | MoM % Change (Daily Selling Rate) |
| BMW | 19,291 | 25,968 | 24,917 | -25.7% | -28.6% | -22.6% | -22.6% |
| Daimler | 22,420 | 27,546 | 26,681 | -18.6% | -21.7% | -16.0% | -16.0% |
| FCA | 149,342 | 168,550 | 137,902 | -11.4% | -14.8% | 8.3% | 8.3% |
| Ford | 164,243 | 192,720 | 157,951 | -14.8% | -18.1% | 4.0% | 4.0% |
| GM | 192,881 | 236,509 | 175,770 | -18.4% | -21.6% | 9.7% | 9.7% |
| Honda | 121,880 | 141,305 | 114,774 | -13.7% | -17.1% | 6.2% | 6.2% |
| Hyundai | 55,464 | 58,949 | 51,564 | -5.9% | -9.5% | 7.6% | 7.6% |
| Kia | 51,499 | 53,405 | 47,870 | -3.6% | -7.3% | 7.6% | 7.6% |
| Nissan | 72,675 | 98,880 | 65,290 | -26.5% | -29.3% | 11.3% | 11.3% |
| Subaru | 56,970 | 64,106 | 53,910 | -11.1% | -14.5% | 5.7% | 5.7% |
| Tesla | 15,581 | 12,800 | 11,150 | 21.7% | 17.0% | 39.7% | 39.7% |
| Toyota | 168,759 | 209,204 | 149,445 | -19.3% | -22.4% | 12.9% | 12.9% |
| Volkswagen Group | 49,073 | 55,882 | 45,831 | -12.2% | -15.6% | 7.1% | 7.1% |
| Industry | 1,189,928 | 1,395,816 | 1,113,464 | -14.8% | -18.0% | 6.9% | 6.9% |
Retail Unit Sales
| Manufacturer | Jul 2020 Forecast | Jul 2019 Actual | Jun 2020 Actual | YoY % Change | YoY % Change (Daily Selling Rate) |
MoM % Change | MoM % Change (Daily Selling Rate) |
| BMW | 18,811 | 24,417 | 24,590 | -23.0% | -25.9% | -23.5% | -23.5% |
| Daimler | 21,715 | 25,907 | 25,350 | -16.2% | -19.4% | -14.3% | -14.3% |
| FCA | 132,416 | 140,348 | 123,904 | -5.7% | -9.3% | 6.9% | 6.9% |
| Ford | 127,109 | 153,555 | 127,449 | -17.2% | -20.4% | -0.3% | -0.3% |
| GM | 164,868 | 200,925 | 161,064 | -17.9% | -21.1% | 2.4% | 2.4% |
| Honda | 121,329 | 140,204 | 114,127 | -13.5% | -16.8% | 6.3% | 6.3% |
| Hyundai | 53,900 | 53,184 | 49,134 | 1.3% | -2.6% | 9.7% | 9.7% |
| Kia | 50,546 | 49,074 | 46,650 | 3.0% | -1.0% | 8.4% | 8.4% |
| Nissan | 66,365 | 80,566 | 59,355 | -17.6% | -20.8% | 11.8% | 11.8% |
| Subaru | 55,560 | 62,426 | 49,221 | -11.0% | -14.4% | 12.9% | 12.9% |
| Tesla | 15,569 | 12,800 | 11,150 | 21.6% | 17.0% | 39.6% | 39.6% |
| Toyota | 166,199 | 197,257 | 144,556 | -15.7% | -19.0% | 15.0% | 15.0% |
| Volkswagen Group | 47,653 | 51,162 | 43,742 | -6.9% | -10.4% | 8.9% | 8.9% |
| Industry | 1,091,152 | 1,238,794 | 1,029,015 | -11.9% | -15.3% | 6.0% | 6.0% |
Fleet Unit Sales
| Manufacturer | Jul 2020 Forecast | Jul 2019 Actual | Jun 2020 Actual | YoY % Change | YoY % Change (Daily Selling Rate) |
MoM % Change | MoM % Change (Daily Selling Rate) |
| BMW | 480 | 1,551 | 327 | -69.0% | -70.2% | 46.8% | 46.8% |
| Daimler | 705 | 1,639 | 1,331 | -57.0% | -58.7% | -47.1% | -47.1% |
| FCA | 16,926 | 28,202 | 13,998 | -40.0% | -42.3% | 20.9% | 20.9% |
| Ford | 37,134 | 39,165 | 30,502 | -5.2% | -8.8% | 21.7% | 21.7% |
| GM | 28,013 | 35,584 | 14,706 | -21.3% | -24.3% | 90.5% | 90.5% |
| Honda | 550 | 1,101 | 647 | -50.0% | -51.9% | -14.9% | -14.9% |
| Hyundai | 1,564 | 5,765 | 2,430 | -72.9% | -73.9% | -35.6% | -35.6% |
| Kia | 953 | 4,331 | 1,220 | -78.0% | -78.8% | -21.9% | -21.9% |
| Nissan | 6,309 | 18,314 | 5,935 | -65.5% | -66.9% | 6.3% | 6.3% |
| Subaru | 1,411 | 1,680 | 4,689 | -16.0% | -19.2% | -69.9% | -69.9% |
| Tesla | 12 | – | – | – | – | – | – |
| Toyota | 2,560 | 11,947 | 4,889 | -78.6% | -79.4% | -47.6% | -47.6% |
| Volkswagen Group | 1,419 | 4,720 | 2,089 | -69.9% | -71.1% | -32.1% | -32.1% |
| Industry | 98,776 | 157,022 | 84,449 | -37.1% | -39.5% | 17.0% | 17.0% |
Fleet Penetration
| Manufacturer | Jul 2020 Forecast | Jul 2019 Actual | Jun 2020 Actual | YoY % Change | MoM % Change |
| BMW | 2.5% | 6.0% | 1.3% | -58.3% | 89.6% |
| Daimler | 3.1% | 6.0% | 5.0% | -47.2% | -37.0% |
| FCA | 11.3% | 16.7% | 10.2% | -32.3% | 11.7% |
| Ford | 22.6% | 20.3% | 19.3% | 11.3% | 17.1% |
| GM | 14.5% | 15.0% | 8.4% | -3.5% | 73.6% |
| Honda | 0.5% | 0.8% | 0.6% | -42.0% | -19.8% |
| Hyundai | 2.8% | 9.8% | 4.7% | -71.2% | -40.2% |
| Kia | 1.9% | 8.1% | 2.5% | -77.2% | -27.4% |
| Nissan | 8.7% | 18.5% | 9.1% | -53.1% | -4.5% |
| Subaru | 2.5% | 2.6% | 8.7% | -5.5% | -71.5% |
| Tesla | 0.1% | 0.0% | 0.0% | – | – |
| Toyota | 1.5% | 5.7% | 3.3% | -73.4% | -53.6% |
| Volkswagen Group | 2.9% | 8.4% | 4.6% | -65.8% | -36.6% |
| Industry | 8.3% | 11.2% | 7.6% | -26.2% | 9.4% |
Total Market Share
| Manufacturer | Jul 2020 Forecast | Jul 2019 Actual | Jun 2020 Actual |
| BMW | 1.6% | 1.9% | 2.2% |
| Daimler | 1.9% | 2.0% | 2.4% |
| FCA | 12.6% | 12.1% | 12.4% |
| Ford | 13.8% | 13.8% | 14.2% |
| GM | 16.2% | 16.9% | 15.8% |
| Honda | 10.2% | 10.1% | 10.3% |
| Hyundai | 4.7% | 4.2% | 4.6% |
| Kia | 4.3% | 3.8% | 4.3% |
| Nissan | 6.1% | 7.1% | 5.9% |
| Subaru | 4.8% | 4.6% | 4.8% |
| Tesla | 1.3% | 0.9% | 1.0% |
| Toyota | 14.2% | 15.0% | 13.4% |
| Volkswagen Group | 4.1% | 4.0% | 4.1% |
Retail Market Share
| Manufacturer | Jul 2020 Forecast | Jul 2019 Actual | Jun 2020 Actual |
| BMW | 1.7% | 2.0% | 2.4% |
| Daimler | 2.0% | 2.1% | 2.5% |
| FCA | 12.1% | 11.3% | 12.0% |
| Ford | 11.6% | 12.4% | 12.4% |
| GM | 15.1% | 16.2% | 15.7% |
| Honda | 11.1% | 11.3% | 11.1% |
| Hyundai | 4.9% | 4.3% | 4.8% |
| Kia | 4.6% | 4.0% | 4.5% |
| Nissan | 6.1% | 6.5% | 5.8% |
| Subaru | 5.1% | 5.0% | 4.8% |
| Tesla | 1.4% | 1.0% | 1.1% |
| Toyota | 15.2% | 15.9% | 14.0% |
| Volkswagen Group | 4.4% | 4.1% | 4.3% |
(Note: This forecast is based solely on ALG’s analysis of industry sales trends and conditions and is not a projection of TrueCar, Inc.’s operations.)
SOURCE: TrueCar